Chris Vizes Data visualisation and more
Jumping Filters
In long form dashboards you may find yourself wanting filters or parameter options to travel with you down the page. Tableau does not support a feature like this but we can use a technique to let the users reposition them at a click of a button. In this blog we will take a look at what I came with and how you can do it too. Read more 20 Jan 2023 - 4 minute read
Marimekko Charts Simplified
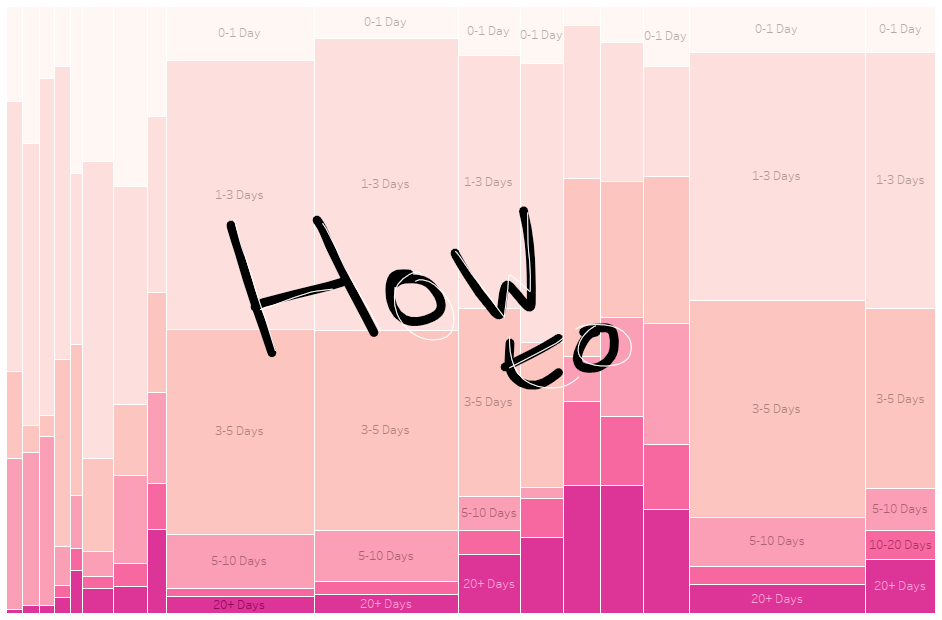
Marimekko charts can be a great way to display distributions of data and to make full use of space. I’m a fan and I like building them but there is a bit of a barrier to entry as they include advanced table calculations and LODs (in Tableau at least). Read more 19 Jan 2023 - 1 minute read
Rebate Projection - What if?
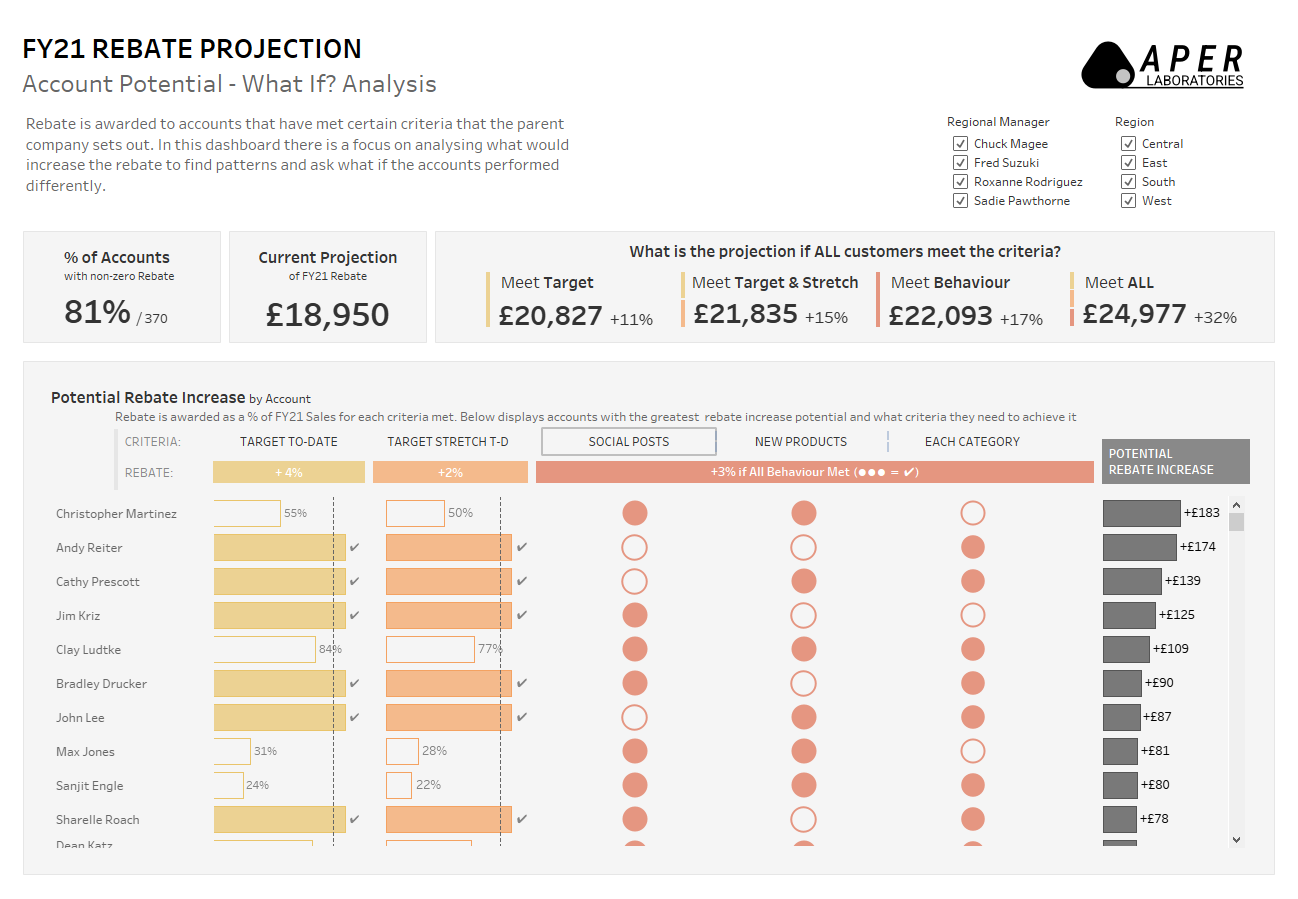
Check out my latest public dashboard analysing rebate projects with mock data. Read more 04 Feb 2022 - less than 1 minute read
Tableau: How to Format Seconds into hh:mm:ss (like a clock)
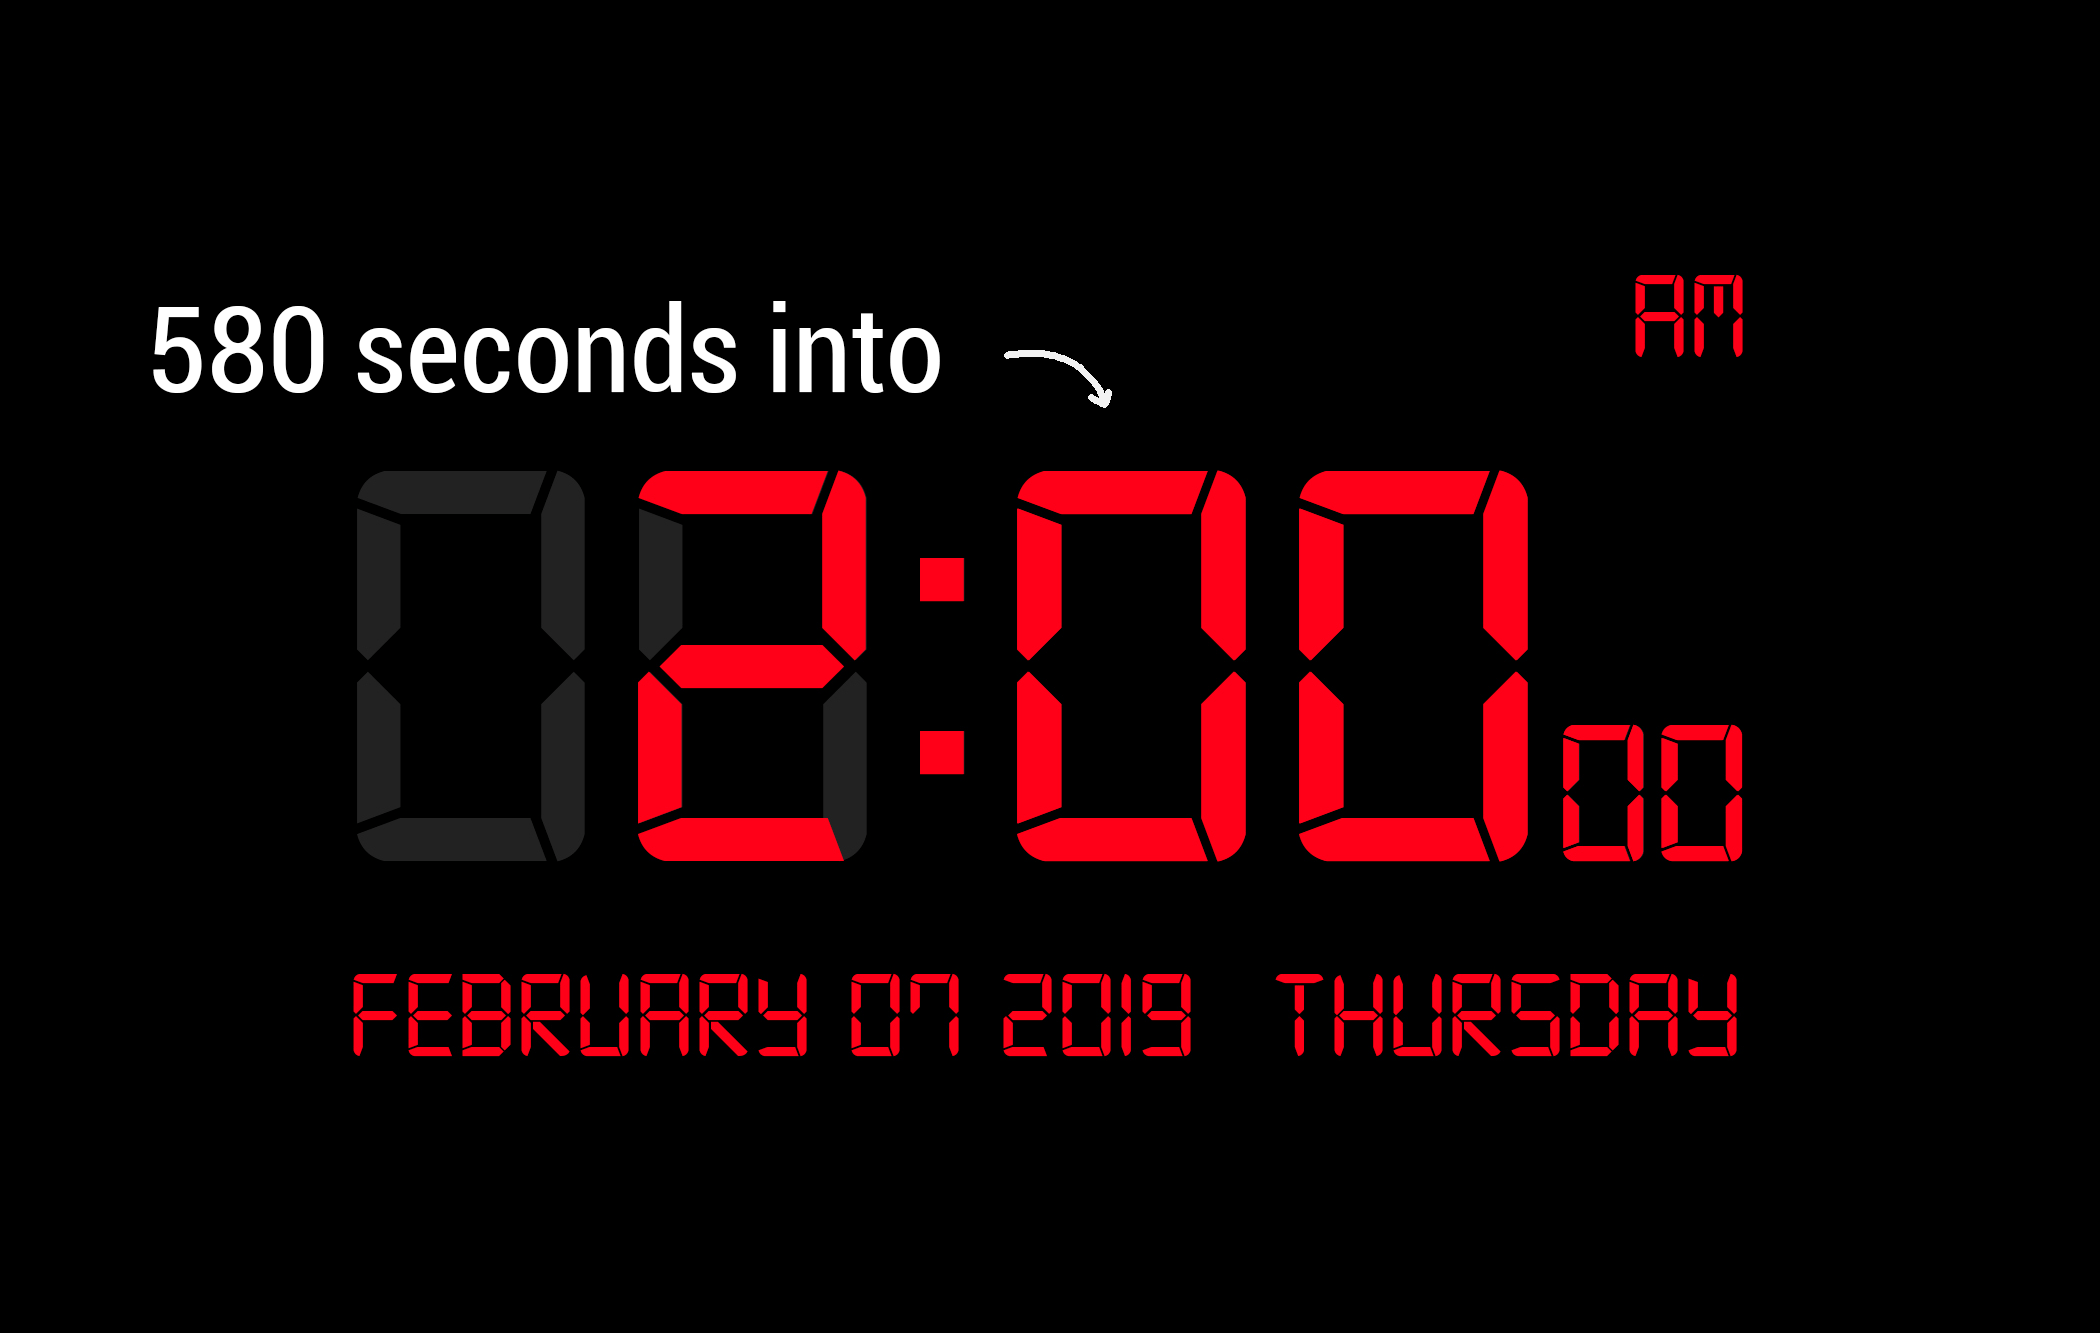
How do you turn a number of seconds, say 678, into the format hh:mm:ss to make it more readable. This blog will show you how to do this within Tableau, and extend it for some other use cases. Read more 09 Jan 2021 - 6 minute read
Kicking off exam preparations with a viz about millionaires
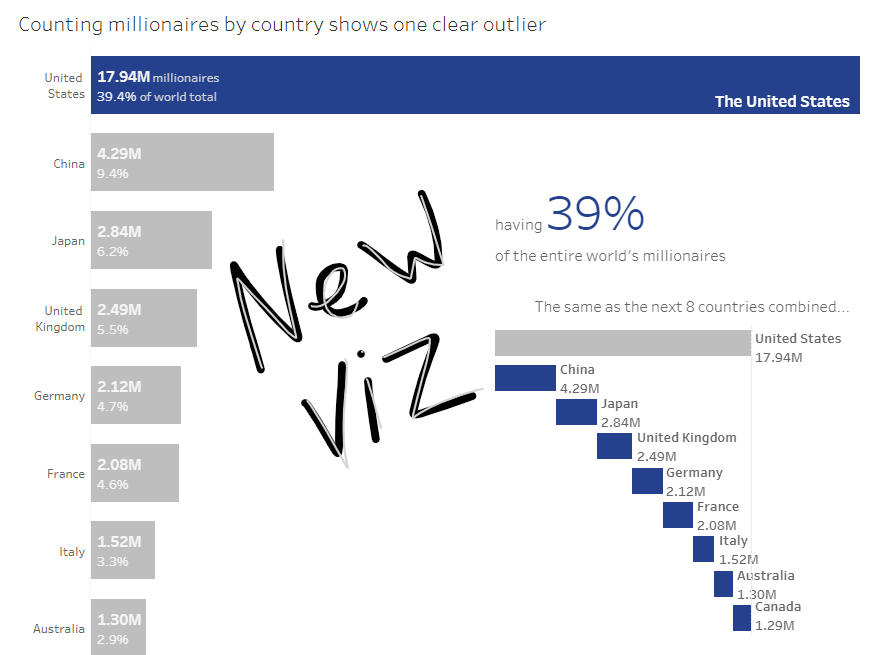
The Plan I’m planning on taking the Tableau Certified Professional exam soon and as a part of preparing for it, I want to practice making dashboards quickly that are effective and follow visual best practice. My plan is to make one each day, spending no more than an hour on each. The time limit here is key as it is an important factor in the exa... Read more 07 Jun 2020 - 6 minute read