Chris Vizes Data visualisation and more
Jumping Filters
In long form dashboards you may find yourself wanting filters or parameter options to travel with you down the page. Tableau does not support a feature like this but we can use a technique to let the users reposition them at a click of a button. In this blog we will take a look at what I came with and how you can do it too.
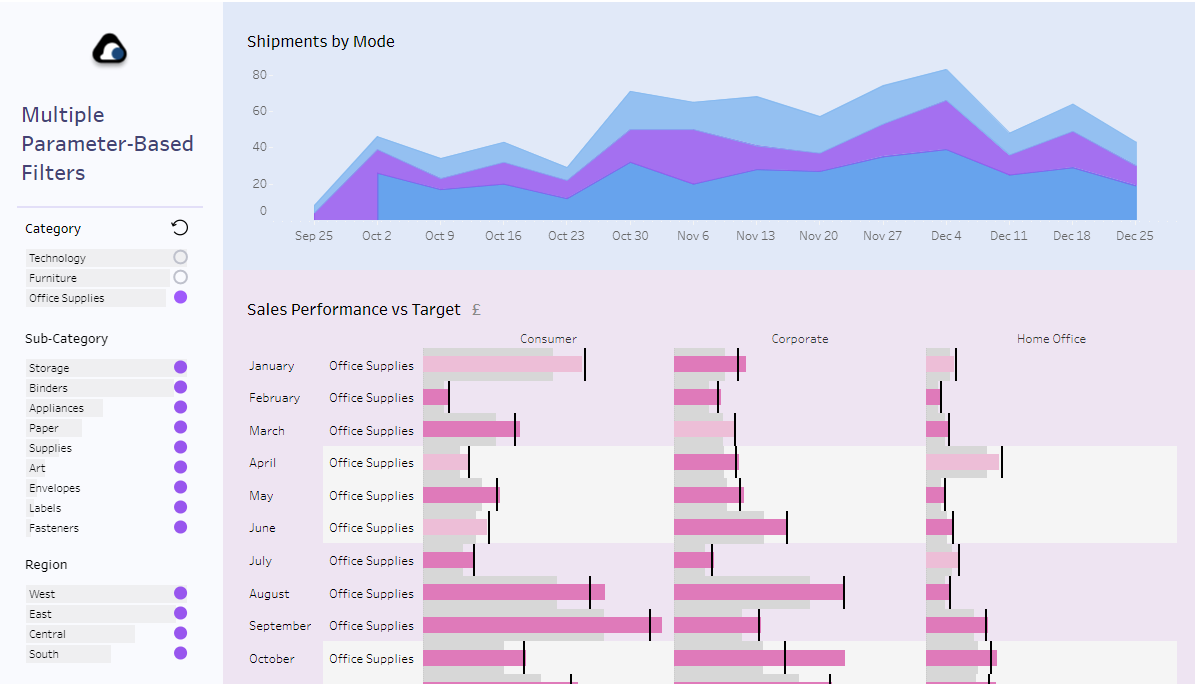
In a Tableau Public dashboard I published recently I took on this challenge and came up with a solution. This blog will make the most sense if you have an explore of it first, so click the link to get started.
Tutorial
1. Dynamic Zone Visibility
Firstly, this dashboard makes extensive use of dynamic zone visiblity, which is a recently added feature. This enables objects and containers in dashboards to be dynamically shown or hidden based on a boolean calculation.
With a dashboard open, select the object you want to dynamically hide and go to the layout pane. This is where you’ll find the “Control visibility using value” option. In here you can select any of your boolean calculations.
When the calculation is true, the object is shown, when it is false it is hidden.
2. Creating Structure of Zones
What we are going to show and hide in the dashboard are blanks. But let’s start showing the dashboard we are going to work on in this tutorial.
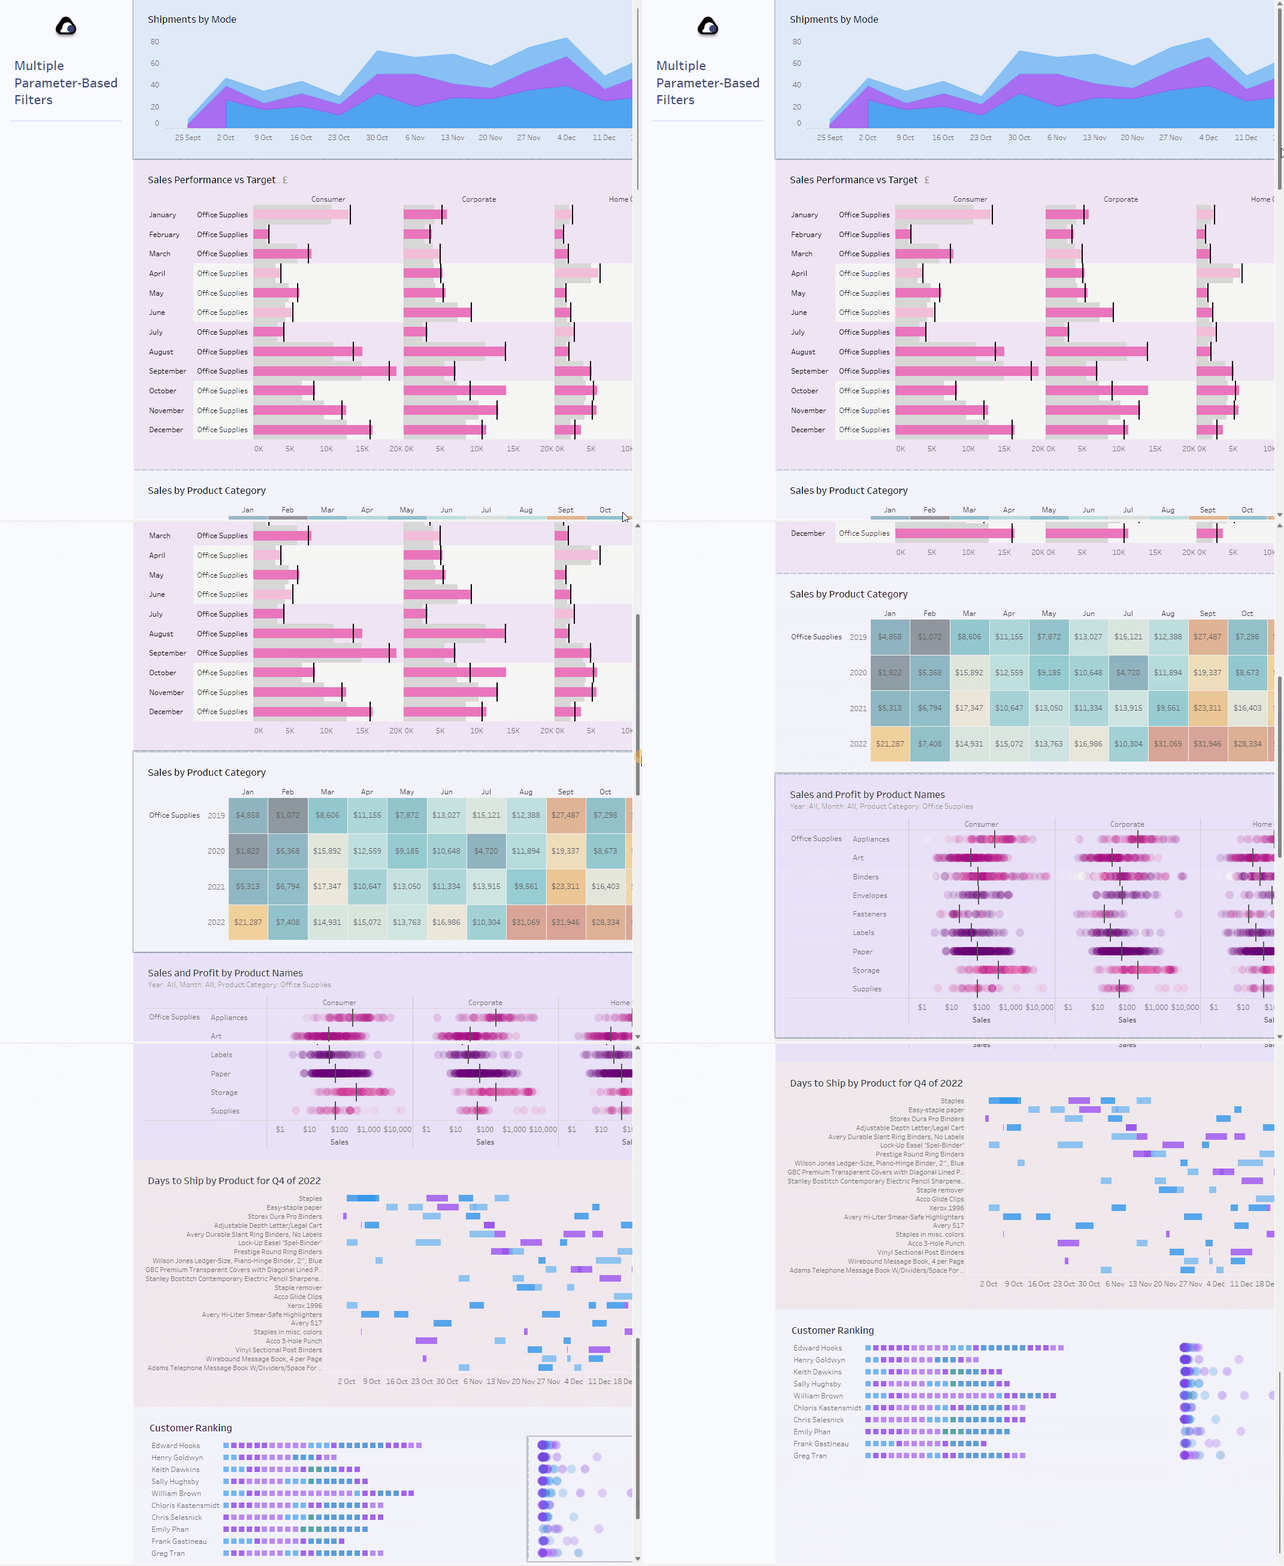
We want to make it so when the use is at any chart in the dashboard, they can interact with the filters, but the dashboard is long.
What we can do is add blanks to the side bar that are the same lengths as the sections of content. So for example this would be the first zone
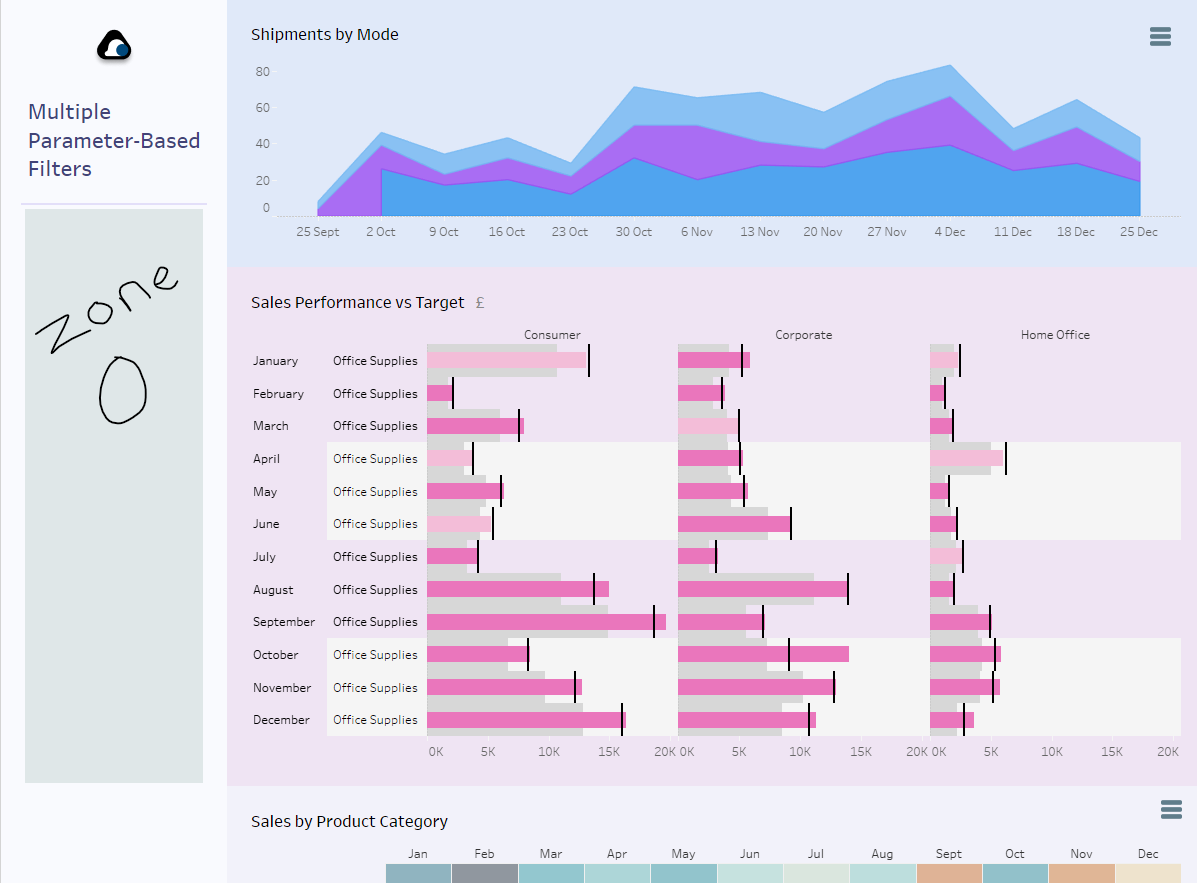
and these the following zones

When the user is at the top of the dashboard, they would want the filters to be in zone 0. When they are looking at the next zone they would want the filters in zone 1 etc.
If we hid all the containers below the zone of interest, and had the filters at the bottoms of the list, then the filters would appear in the zone we wanted.
For example, if we were looking at the charts in zone 1, we would want to hide the blanks in zones 1, 2 and higher, like shown below:
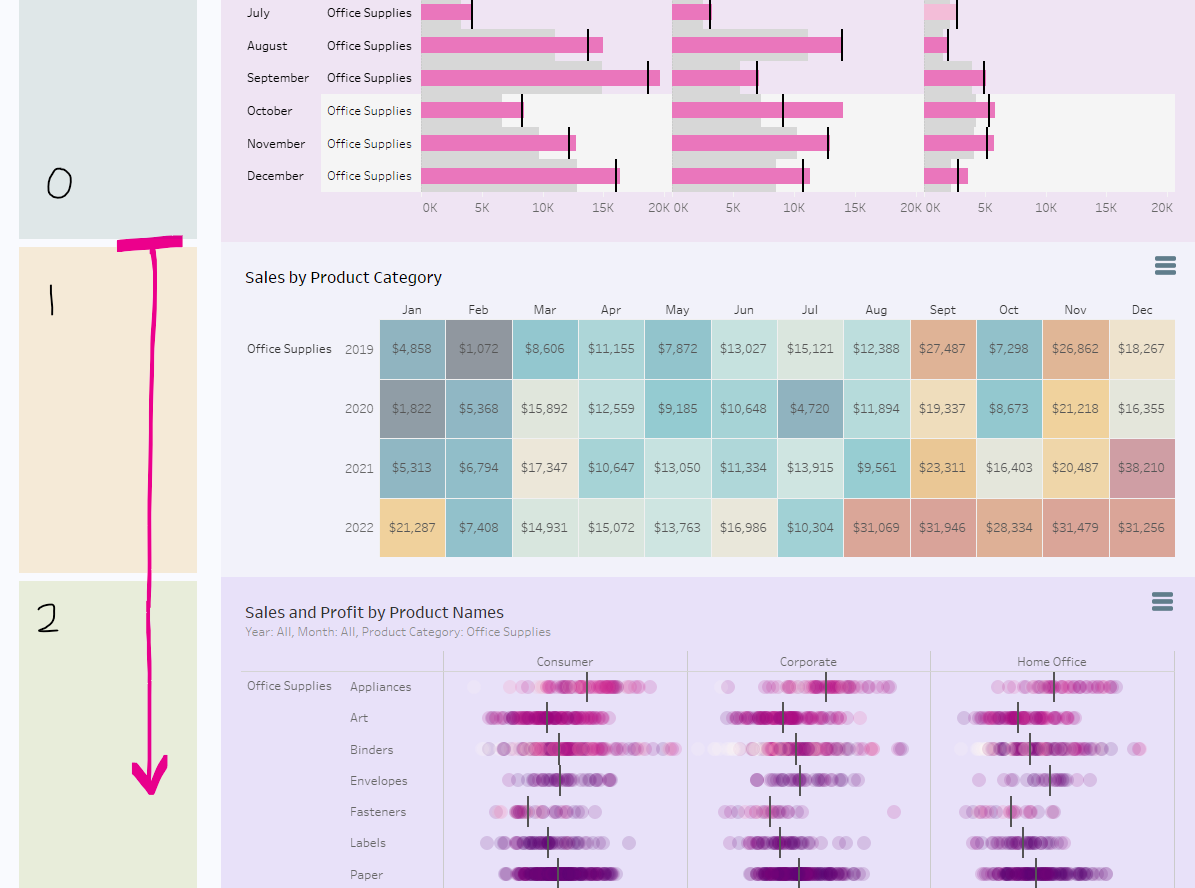
So by the end of this step you will have a blank in the side bar that is the height of each zone of content.
3. Adding a new Parameter
Now we need a parameter that we can use to track what zones to hide/ where the user is on the dashboard.
So create a new parameter that is an integer.
4. Make Blanks Hide Based on Parameter
Now we need to make the boolean calculations that will control the zone visibility. We need a calculated for each zone.
Zone 0 should only show when the user is in zone 1 or above. Zone 1 should only show when the user is in zone 2 or above. Etc.
So the calcualtions will look like:
[Scroll Position >= 1?]
[Scroll Position Parameter] >= 1
[Scroll Position >= 2?]
[Scroll Position Parameter] >= 2
Etc
Now go back to the dashboard, select zone 0 and set the “Control visibility using value” to the first calculation. E.g.
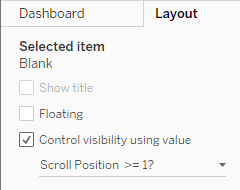
Then set the zone visibility for zone 1 to [Scroll Position >= 2?] and so on.
At this point you can manually change the value of the parameter to test the zones showing and hiding. Our next step is to make this more user friendly with buttons.
5. Creating Buttons
This step is about making the buttons that sit in each zone of the dashboard and let the user change the parameter to the zone they are in (hence hiding other zones because of step 4).
Create a new sheet, add the zone number to detail, set the mark type to shape and choose your shape. This is clearest in a video, so watch below:
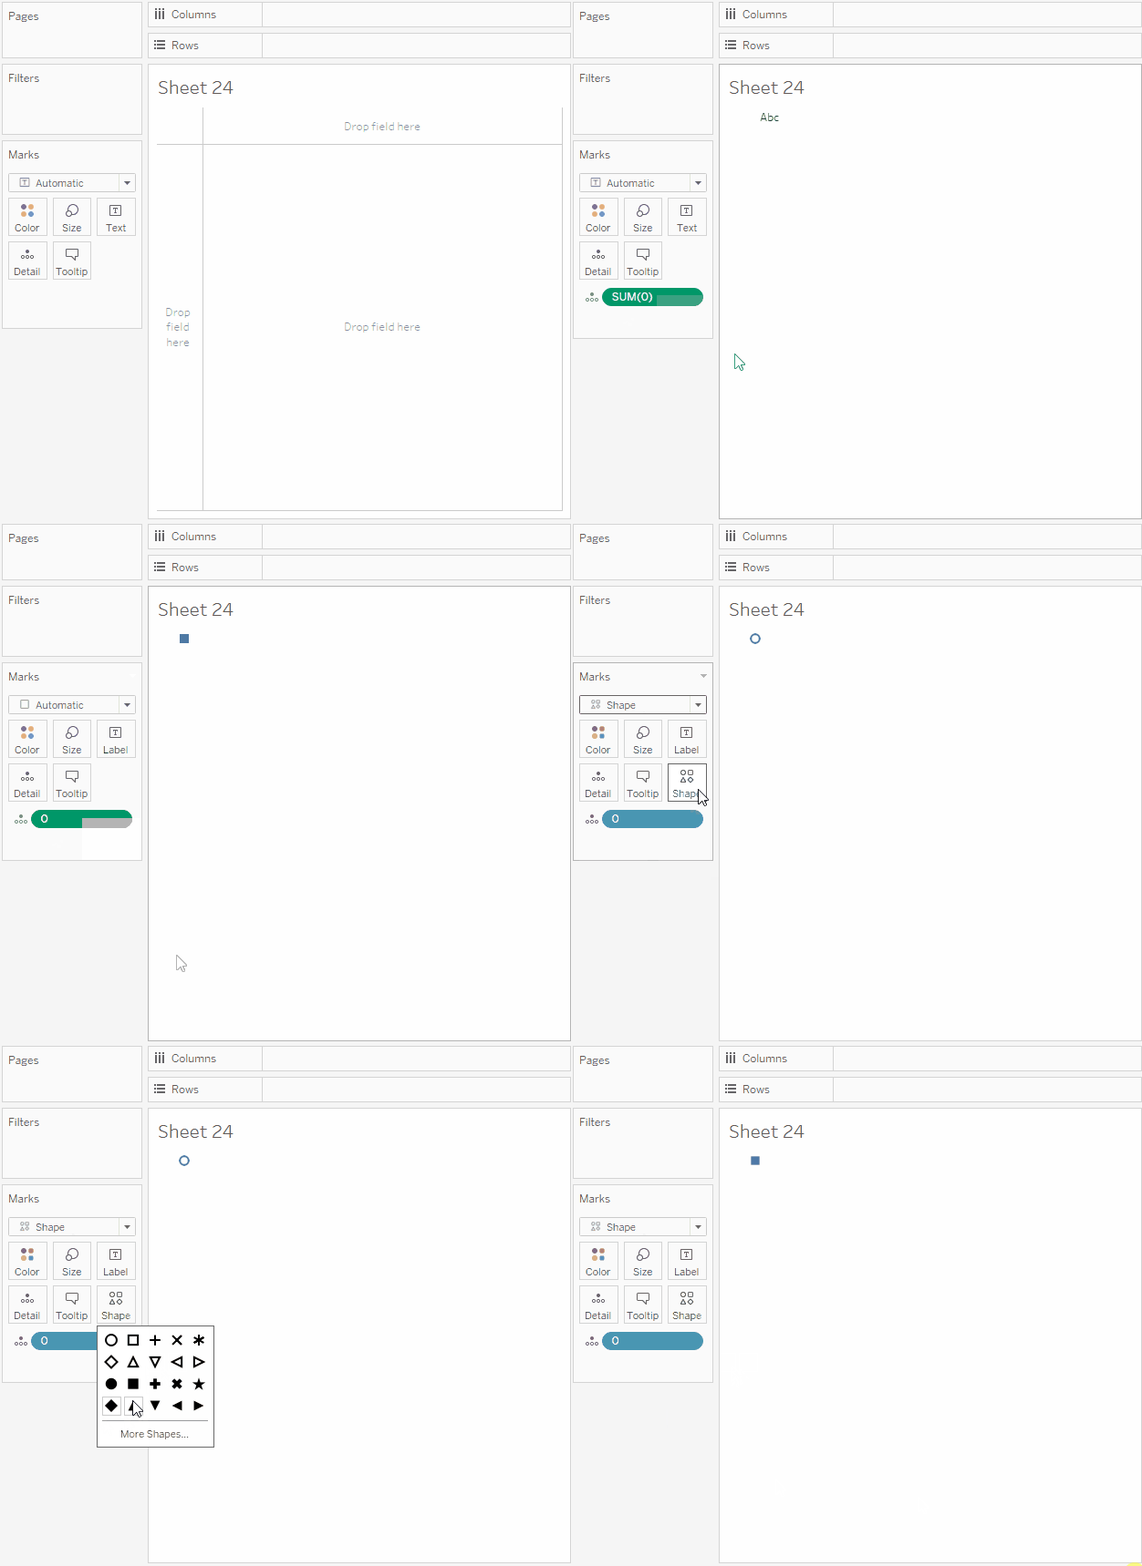
Make as many buttons as you have zones and increment the number you put on detail.
Add these buttons to your dashboard, placing the zone 0 button near zone 0 etc.
6. Setting up Parameter Actions
This step uses parameter actions on the dashboard to take the number from the button and add it to the parameter.
Make a parameter action for each zone button as follows: New parameter action, source sheet: the button sheet, target parameter: scroll position parameter, source field: the number you added to detail in the button.
This will look something like:
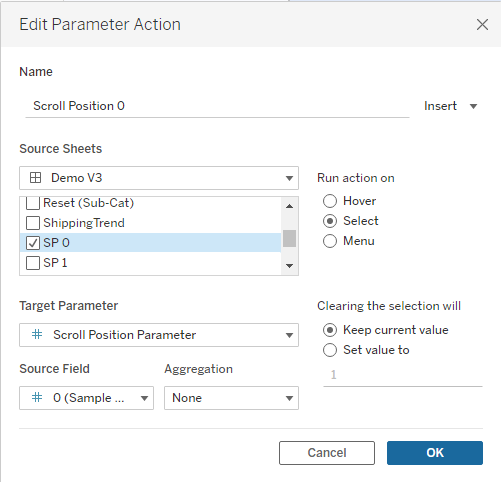
If you have 4 zones, then by this point you will have 1 parameter, 4 blanks in your dashboard, 4 buttons/ sheets on your dashboard and 4 parameter actions set up.
Click on a button and watch those zones move about!
7. Add your filters
The final thing we need to do is add the filters to the very bottom of the container holding all of our blanks.
So the sidebar of the dashboard is now a vertical, containing all of the blanks in the correct order and then the filters at the bottom.
You’re done!
Example
Take a look at what I created and if needed give it a download to explore in more detail.

Thanks for reading
Written on January 20th, 2023 by Chris Meardon